
Etude et Simulation de la Qualité de l'air en Ile de France
Project summary
Tropospheric photooxidant pollution was investigated in detail for the first time over the Paris area during the Etude et Simulation de la QUalite de l'air en Ile-de-France (ESQUIF) project. From 1998 to 2000, twelve Intensive Observation Periods (IOPs) were carried out. They represent various meteorological situations, all leading to strong polluted events over Paris and surroundings. During these periods, measurements were performed with a new strategy of circular flights around the city, coupled to stations or remote-sensing surface measurements. Such data obtained at various altitudes and at different ranges from the city center document the evolution of pollution events on horizontal and vertical scales. In addition, ESQUIF also allowed for evaluation of models developed in parallel to the project. In this overview, ESQUIF is presented in terms of the set of IOPs. Periods are compared in terms of meteorology and resulting types of pollution episodes. The occurence of these latter events is discussed in terms of local production and influence of long-range transport. Using both measurements and model simulations, some important results are highlighted, especially concerning accuracy of boundary conditions, processes of mixing within the boundary layer, surface emissions estimation (including biogenic), and photolysis attenuation. Finally, results from data assimilation studies and sensitivity studies using adjoint modelling and a Monte-Carlo approach are also presented.
-
Project final report (in french): EsquifRapFinal2000.pdf

- Project coordination: Robert Vautard, Laurent Menut (LMD)
Reference papers
- Vautard R., Menut L., M. Beekmann, P. Chazette, P. H. Flamant, D. Gombert, D. Guedalia, D. Kley, M.P. Lefebvre, D. Martin, G. Megie, P. Perros, G. Toupance, 2003,
A synthesis of the ESQUIF field campaign, Journal of Geophysical Research - Atmospheres, 108, D17,
- Menut L., 2003,
Adjoint modelling for atmospheric pollution processes sensitivity at regional scale during the ESQUIF IOP2
O3-NOx-VOC sensitivity indicators in Paris: results from models and ESQUIF measurements, Journal of Geophysical Research - Atmospheres, 108, D17,
Measurements and modeling of Atmospheric pollution over the Paris area: An overview of the ESQUIF project, Annales Geophysicae, 18, no 11, 1467-1481,
General aim of the ESQUIF project
Despite progress over the past twenty years in understanding of the physics and chemistry that govern air quality, there are a number of unsolved issues in this field. A lack of extensive and continuous observations is partly to blame for this situation. Although there are routine observations of air quality in some areas, such observations typically are made at ground level and cover a limited set of species. Thus, atmospheric chemists have relied on intensive measurement campaigns to address the most pressing questions.
The main goal of the Etude et Simulation de la QUalite de l'air en Ile-de-France (ESQUIF) project was to characterize pollution in a large urban area and test the ability for air quality models to reproduce the most important features of the urban plume. The campaign involved extensive measurements in the Paris (France) region (Figure 1), a site selected for several reasons to allow the major focus to be on chemical issues. First, Paris is distant from the ocean or mountains, such that the effects of variable orography are minor and meteorological parameters should be straightforward to simulate. Second, it is one of the greatest urbanized area in Europe, and it is located far from other big cities, so that the signatures and origins of pollution are easier to determine.
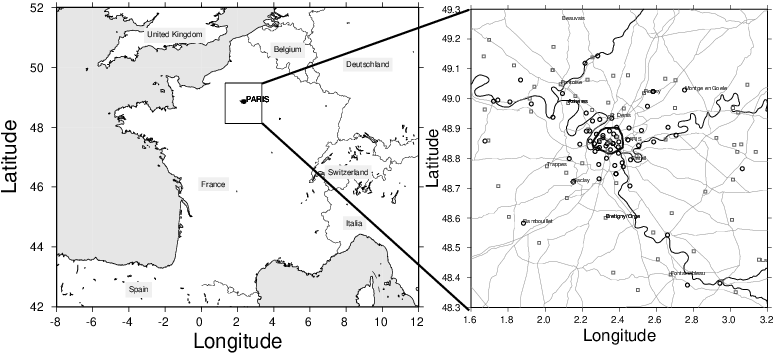
Figure 1: Map of France [left] showing in a box the Paris area. A zoom of the Paris area [right] displays as circles and squares the location of the Airparif and Meteo-France networks, respectively
During ESQUIF, measurements were performed mainly during the summers 1998 and 1999 in a dozen 1-3 data intensive observation periods (IOPs). The instrumental set-up was extensively described in [Menut et al.., 2000] and [Vautard et al., 2001]. The goal of this overview is to highlight the main results obtained during the project. Additional detail can be found in subsequent articles of this special section, most of which focus on subsets of results obtained during individual IOPs. We present here an overview of these IOPs. Because results discussed in the following papers deal mostly with photochemistry (i.e. chemical regimes, sensitivity to emissions, etc.), and not Meteorology, here we will present an overview of the main meteorological situations during the campaign.
Prior to the field campaign, the ESQUIF scientific committee raised a number of key scientific points that would be addressed by the campaign and during subsequent numerical experiments. The main issues that were addressed in detail are:
- (i) Sensitivity of ozone formation to a number of factors, including:
- long-range transport of ozone and its precursors from remote, but high emissions areas in Europe,
- urban emissions and, specifically, the nature of various chemical regimes,
- the importance of biogenic versus anthropic emissions.
- (ii) Evaluation of the available emission inventory, including NOx, CO and detailed volatile organic compounds (VOCs).
- (iii) The role of aerosols and clouds in modification of photolysis rates.
- (iv) The role of photochemistry in wintertime nitrogen dioxide episodes.
- (v) The development of methods and models allowing accurate, spatially distributed, representations and forecasts of pollutant fields.
- (vi) The characterization of aerosol distributions and their evolution around the city of Paris.
Paris typically is not a very polluted city. This is due mostly to dilution of the urban plume by relatively clean oceanic air and significant dispersion by prevailing winds. In order to analyze clear signals from urban pollution we had to focus on the specific, but rare occasions when prevailing winds were very weak. Thus, a successful IOP required the availability of accurate weather and chemical forecasts several days in advance.
Weather forecasts with a specific attention on this campaign were provided by Meteo-France. Chemical forecasts were performed using several approaches. At the beginning of the campaign (e.g., 1998-1999), operational forecasts of ozone and NO2 were only available from statistical models operated by the regional air quality monitoring network AIRPARIF. At that time, several chemistry-transport models (CTMs) had also been developed, but they were not fully validated. Thus, ESQUIF provided a unique opportunity to test and validate CTMs in forecast modes. In fact, only the CHIMERE model was ready to do such a forecast exercise at that time, and those results are reported in [Vautard et al., 2001].
| IOP | Dates | Airmass origin | Remarks (whole IOP) |
| 1998 summer | |||
| 1 | 25 -> 26/07/1998 | Continental. 1-2 days stagnation | Mostly cloudy by medium and high clouds. no wind |
| 2 | 06 -> 12/08/1998 | Continental. 2-4 days stagnation | Clear sky. Hot temperature. Light winds |
| 1999 summer | |||
| 3 | 16 -> 17/06/1999 | Continental 3-4 days stagnation | Overcast after 12UT. Wind (NE) < 3 m/s |
| 4 | 25 -> 26/06/1999 | Continental. 3-4 days stagnation | Clear sky. Wind (E) ~ 5 m/s |
| 5 | 01 -> 02/07/1999 | Maritime | Clear sky. Wind (SE) ~ 4 m/s |
| 6 | 16 -> 18/07/1999 | Maritime then stagnant | Clear sky |
| 7 | 24 -> 25/07/1999 | Continental. 2-3 days stagnation | Paris plume tracking in Brittany. Windy |
| 8 | 28 -> 31/07/1999 | Continental. 3-4 days stagnation | Light wind < 2 m/s |
| 1999-2000 winter | |||
| 9 | 07 -> 08/10/1999 | Continental. 2-3 days stagnation | Anticyclonic situation. NO-> NO2 experiment |
| 10 | 26 -> 28/01/2000 | Continental | High [NOx]. Plume to West of Paris |
| 2000 summer | |||
| 11 | 19 -> 20/07/2000 | No photooxydant peak, moderate wind | Aerosols experiments |
| 12 | 30 -> 31/07/2000 | Dry conditions, no stagnation | Aerosols experiments |
To highlight IOPs periods from the summers of 1998 and 1999, the main meteorological characteristics of these summers are presented. To appreciate their differences, characteristics of the various IOPs are compared in Section 2. Finally, the research topics studied during the project are described. The major new findings are outlined, with emphasis on those that are described in more detail in the papers that follow.
Meteorological conditions during summers 1998 and 1999
IOPs within the whole summers
Figure 2 presents a synthesis of dynamical and chemical conditions that occurred during the summers of 1998 [left panel] and 1999 [right panel]. Within each plot, intensive observation periods (IOPs) are shaded gray. For wind speed |U| (m/s, surface temperature (oC) and cloudiness (0-1), data are issued from ECMWF fields (at the first vertical level i.e z ~ 35m) and diurnally averaged over a day. The bottom panel corresponds to AIRPARIF network [O3] (ug/m3) surface measurements: for each day, the value displayed corresponds to the [O3] peak over the whole Paris area. Figure 2 indicates that the mean wind speed varied from 0 to 8 m/s. However, IOPs were always scheduled for relatively stagnant periods when wind speeds were less than 2m/s (except for IOP4, where winds were 3m/s). In 1998 and 1999, all IOPs occurred when temperatures were highest. For example, during IOP2 the highest temperatures during the entire summer of 1998 were observed. In addition, cloudiness (integrated over the whole atmospheric column) was highly variable. During IOPs, averaged cloudiness was always less than 0.4 (with a maximum of 1). Finally, IOPs occurred when highest [O3] concentrations prevailed, consistent with the situation for temperature.
Comparisons between IOPs
For the entire set of summertime IOPs, some meteorological values were similar, but different phenomena were also observed. Although the result was always an observed peak in oxidant levels, the meteorological situations were not identical. The differences were mainly due to differences in the synoptic origins of the air masses. A large portion of France lies along the coast of the Atlantic Ocean (west), whereas another part is surrounded by very industrialized countries (north and east). Thus, relatively clean or relatively polluted air masses are advected over Paris, depending on the direction of the prevailing winds.
For most of the IOPs, peaks in pollutants were observed when air masses remained for several days over large sources regions, such as Benelux and Germany at the north and north-east of the Paris area (IOPs 1, 2, 3, 7, 8). But there were also occasions when high levels of pollutants were observed in conditions where air masses originated from the Atlantic Sea (IOPs 2, 5 and 6) (e.g. relative clean maritime air). A common feature of these latter situations was the very weak winds. Consequently, even though air masses originated from over the sea during these IOPs, stagnant conditions occurred over Paris, accompanied by high temperatures and clear skies.
Based on results from the IOPs, pollutants observed during the ESQUIF project can be split into two components, from air masses advected over the region and from local sources. Such a characterization of sources is a well-known problem in defining the chemical boundary conditions for initialization of models(see Section 4.1). Thus, another goal of the ESQUIF project was to quantify the transport of pollution from Paris to other regions. In the area surrounding Paris, such pollution consists of transport of 'ozone plumes' originating in Paris. The impact of such plumes was quantified in terms of chemical regimes during IOPs 6 and 8, results of which are presented in [Sillman et al, 2003]. At still larger spatial scales, long-range transport of pollution several hundred kilometers from the city (IOPs 4 and 7) is important. During ESQUIF, 2003 was studied using the technique of adjoint modelling sensitivity [described in Schmidt and Martin, 2003].
Figure 2: Overview of meteorological and chemical conditions occuring during summers 1998 [left panel] and 1999 [right panel].
Comparisons within IOPs
Not only were there differences between IOPs, meteorological and chemical variations were observed within an individual IOP. For example, during the IOP2, when the first day was characterized mainly by local production of oxidants, the end of the period was characterized by mixing of local sources with those transported from long range (see also [Menut et al., 2000b]). Whereas the beginning of the IOP (7 August 1998) brings mainly oceanic air masses (from the Atlantic Ocean) with low concentrations of pollutants, a change of the wind direction occurred during the IOP, and winds show, such that the air masses stagnate over strong source areas (Great Britain, the Benelux countries and the Rühr area in Germany). The observed local changes are, of course, influenced by synoptic changes. The impact of this is seen, in particular, in the vertical temperature soundings. From 7 to 9 August 1998, the height of the temperature inversion increases from 800m (at the maximum) to 2800m [Hourdin et al., 2001]. These changes considerably influence the capacity of the boundary layer to vertically mix the primary pollutants emitted within the surface layer, as well as the ability to exchange polluted air with relatively cleaner air from more distant regions at higher altitudes. A study, based on lidars profiles performed in Palaiseau (25km southwest of Paris), characterizes the coupling between the residual layer and the convective layer at the beginning of the day [Fochesatto et al., 2001]. By comparison with simulations performed with the meso-scale MESO-NH model [Lafore et al., 1998], it was shown that the residual layer could strongly interact and exchange with the convective layer and, thus, was not entirely isolated.
Pollutants concentrations during summers 1998 and 1999
A synthesis of the average and maxima of surface ozone concentrations (in ug/m3) observed in Paris and in the entire Paris area are shown in Table 2. The hours corresponding to these peaks are also reported. For the "regional" peaks, also reported are the position of the station relative to Paris (for example, W = station in the West of Paris). Concentrations exceeding the 'public alert' threshold of 180 ug/m3 are shown in bold in Table 2.
The concentrations of ozone within Paris are always less than those over the whole region. This is explained by titration of ozone by NO, which is most strongly emitted within the city. For the few days when this is not the case, it is noted that the "regional" peak is, in fact, observed for a peri-urban station, very near the city. This feature highlights the problem of representativity of ground sampling. The characterization of the representativeness of surface stations for analysis and data assimilation is of primary interest, and constituted one of the main research thrusts of this project [N. Blond, 2002].
Within the city of Paris, peaks in ozone were observed 1 to 3 hours before the maxima over the entire region were observed. This is explained by the transport of the ozone plume. Under weak wind conditions, the plume remains within the region of the city, and its concentration continues to increase as it travels over the strong peri-urban sources. The majority of the peaks occur in mid-afternoon, during maximum solar insolation. They occur during hours that vary widely between 11:00 and 16:00 UTC. This range is the result of small-scale meteorological processes that are poorly sampled and, thus, badly simulated. In particular, the peaks are determined by the urban ABL growth rate and maximum depth, and the role of the entrainment zone, as well as the role of thin residual layers where ozone is trapped. One notable exception to this is the peak that formed on 12 August 1998 (IOP2). In this particular case, a major pollution episode is ending, and the strong nocturnal concentrations observed correspond to ozone produced during the previous the day (August 11, the most polluted day of summer 1998).
Main research topics
The ESQUIF experiment was designed to provide a more complete description of the atmospheric chemical composition up and around the Paris city. This goal was achieved by the use of numerous aircraft measurements at several ranges from the city center and different altitudes. The field studies were devoted, in part, to examine of the chemical boundaries of the studied domain. This was the first step in characterization of the relative magnitudes of advected air masses on local pollutants. In the region surrounding Paris, studies were carried out to evaluate the impact of photolysis on chemical reaction rates. Within the Paris area, comparisons were done between the large set of measurements and model simulations constrained by local emissions data [Vautard et al., 2003].
Another part of the field research component was devoted to the small-scale processes occurring within the studied domain. This concerns mainly the vertical exchanges of pollutants within the boundary layer, the stability of the residual layer [Fochessatto et al., 2001], and a new non-local mixing parameterization in the dynamical model LMDz [Hourdin et al., 2002].
Regional continental scale interaction
With no important orographical forcings, over the Paris area one can expect a fairly simple meteorology that is relatively easy to simulate. But in the absence of dominant forcing, it is also necessary to better understand meteorology at longer distances. Even if the main goal of the project remains the Paris area (~100x100km), from the very start of the project it appeared that it was necessary to carry out measurements over the whole of northern France (~800x800km). This justified the choices of aircraft measurements at the mesoscale to understand origins of the air masses entering Paris. In the same way, this explains the IOP7 measurements strategy, in order to follow the Paris ozone plume towards the West of France.
The experimental results highlight the limitations of CTMs that employ "climatological" boundary conditions. Although studies of other polluted cities (those with local dominant forcings only) that employ "climatological" boundary conditions have been successful, this approach is not possible for the Paris region. Consequently, two new Chemistry Transport Models (CTM) were developed, named MOCAGE [Peuch et al., 1999] and CHIMERE [Vautard et al., 2001; Schmidt and Martin, 2003], from the regional to the global scale.
Determination of accurate boundary conditions requires the use of a realistic model at a larger scale than the studied area. The Paris area may appear as a "very urbanized island" in the middle of great rural areas. Thus, to have realistic simulations of pollutants in these rural areas, the large scale CTM needs realistic biogenic emissions. The ESQUIF project represented a good opportunity to more precisely study these biogenic emissions [C. Sarrat, 2002], [Derognat et al., 2003]. In the latter paper, a biogenic VOCs emission database was developed and used with the CHIMERE model (continental and regional scales). This database was validated during ESQUIF by comparison between model simulations and aircraft measurements of isoprene. Results showed that the difference was less than 10%. It was also shown that the continental contribution of biogenic VOCs to the Paris ozone plume may reach up to 35 ppb of ozone for temperatures larger than 35oC (for example during the IOP2).
Surface emissions
Because emissions are some of the key inputs of CTMs, much work during ESQUIF focused on this aspect of air quality modeling. Since 1998, the Paris area has one of the best emissions inventories in France. This emissions inventory, provided by AIRPARIF, was used by all the model teams of the ESQUIF project. A critical comparison between surface and aircraft measurements and modeled concentrations of numerous VOCs is proposed by [Vautard et al., 2003].
| IOP | Date | Paris | Paris Area [150x150km] | |||||
| [O3] | [O3]max | Time | [O3] | [O3]max | Site | Time | ||
| ug/m3 | ug/m3 | (UTC) | ug/m3 | ug/m3 | (UTC) | |||
| 1 | 25 / 7 / 1998 | 61.4 | 115.0 | 15 | 64.6 | 146.0 | SW | 16 |
| 26 / 7 / 1998 | 61.4 | 135.0 | 15 | 64.7 | 148.0 | S | 14 | |
| 2 | 06 / 8 / 1998 | 45.3 | 147.0 | 15 | 52.8 | 157.0 | NE | 16 |
| 07 / 8 / 1998 | 41.0 | 149.0 | 13 | 54.9 | 260.0 | SW | 16 | |
| 08 / 8 / 1998 | 57.5 | 172.0 | 11 | 71.9 | 237.0 | W | 15 | |
| 09 / 8 / 1998 | 99.4 | 218.0 | 16 | 102.1 | 244.0 | SW | 16 | |
| 10 / 8 / 1998 | 71.5 | 226.0 | 12 | 78.9 | 225.0 | NE | 12 | |
| 11 / 8 / 1998 | 100.9 | 274.0 | 14 | 112.0 | 340.0 | NE | 15 | |
| 12 / 8 / 1998 | 69.6 | 134.0 | 2 | 75.8 | 129.0 | W | 2 | |
| 3 | 16 / 6 / 1999 | 54.2 | 150.0 | 13 | 65.7 | 211.0 | SW | 14 |
| 17 / 6 / 1999 | 56.9 | 133.0 | 12 | 73.0 | 176.0 | SE | 13 | |
| 18 / 6 / 1999 | 49.7 | 97.0 | 16 | 58.4 | 115.0 | SW | 15 | |
| 4 | 25 / 6 / 1999 | 78.4 | 145.0 | 13 | 86.7 | 167.0 | SW | 16 |
| 26 / 6 / 1999 | 61.0 | 117.0 | 12 | 66.1 | 138.0 | NE | 12 | |
| 5 | 01 / 7 / 1999 | 27.1 | 68.0 | 12 | 33.7 | 94.0 | SE | 10 |
| 02 / 7 / 1999 | 54.8 | 119.0 | 13 | 58.0 | 186.0 | NW | 14 | |
| 03 / 7 / 1999 | 43.9 | 81.0 | 10 | 47.5 | 101.0 | NE | 11 | |
| 6 | 16 / 7 / 1999 | 64.2 | 130.0 | 16 | 64.7 | 163.0 | E | 17 |
| 17 / 7 / 1999 | 74.3 | 166.0 | 12 | 78.8 | 266.0 | W | 16 | |
| 18 / 7 / 1999 | 95.3 | 179.0 | 13 | 88.3 | 191.0 | NW | 12 | |
| 19 / 7 / 1999 | 68.9 | 114.0 | 15 | 66.0 | 123.0 | SW | 14 | |
| 7 | 24 / 7 / 1999 | 5t.2 | 99.0 | 15 | 60.3 | 126.0 | SW | 14 |
| 25 / 7 / 1999 | 67.8 | 118.0 | 23 | 70.2 | 132.0 | W | 22 | |
| 26 / 7 / 1999 | 72.8 | 135.0 | 16 | 83.4 | 163.0 | SW | 15 | |
| 8 | 28 / 7 / 1999 | 76.1 | 140.0 | 13 | 93.4 | 185.0 | SW | 15 |
| 29 / 7 / 1999 | 78.5 | 165.0 | 15 | 94.9 | 228.0 | SW | 15 | |
| 30 / 7 / 1999 | 82.8 | 207.0 | 14 | 100.0 | 242.0 | W | 15 | |
| 31 / 7 / 1999 | 72.1 | 169.0 | 11 | 92.8 | 206.0 | NW | 13 | |
| 01 / 8 / 1999 | 66.3 | 156.0 | 15 | 88.4 | 189.0 | W | 15 | |
Model versus measurements
The study by [Vautard et al., 2003] examines the accuracy of the emissions inventory at the regional scale. Starting from a reference run (calculation of OH fields), a modified chemical mechanism of type VOC+OH allows for calculation of the concentration of individual VOCs. Qualitatively, and by comparison with aircraft measurements, the model reproduced well the spatial distributions of these emissions. However, it was shown that the model overestimates and underestimates various individual VOC species, whereas some other emitted species, such as NOx and CO, were accurately reproduced in the emissions inventory.
Model sensitivity and uncertainty
For ESQUIF, a Bayesian Monte Carlo uncertainty analysis was developped. Even if the measurement constraint from circular flights and ground based sites allows to significantly reduce the model uncertainty, it is still substantial, i.e. between 15 and 30% in ozone maxima, both for a reference and a 50% reduced emission scenario [Beekmann et al., 2003]. [Sillman et al., 2003] characterized the sensitivity of the Parisian plume to NOx and VOCs concentrations and showed that the Paris area is mainly VOC limited. Concerning emissions, and more generally on the whole set of CTM parameters, [Menut, 2003] proposed a classification of the meteorological and chemical processes that influence the final simulated concentrations of O3, Ox and NOx (IOP2 using an adjoint model).
Photolysis
Mainly produced by photolysis processes, ozone is particularly sensitive to the phenomena that attenuate solar UV radiation. This motivates two particular studies, the first one a direct comparison of measurements of J(NO2) within Paris with the TUV model, the second, a study of chemical partitioning within aerosols. On the basis of these analyses [Vautard and ESQUIF TEAM, 2001], the values of J(NO2) are only attenuated about 12% compared to the modelled reference values. Moreover, it was found that the majority of particles had diameters not exceeding 300 nm. Another study, using the CHIMERE model, allowed for implementation of a new parameterization of the attenuation of photolysis rates, one based on use of ECMWF cloud cover. According to a statistical regression, and after simulation of the entire summers of 1998 and 1999, it was shown that explicitly accounting for cloudiness considerably improved the simulations of surface ozone concentrations over Western Europe. This improvement is most significant in northern Europe, the area that is most cloudy.
Data assimilation
In order to improve understanding of pollution processes, a major goal of this project is to improve the daily forecast of peak ozone abundances. Toward this goal, a method based on optimal interpolation was developed for regional scales [N. Blond, 2002]. This approach, which mathematically combines model simulations and measurements, allows for generation of maps of ozone concentrations that are as realistic as possible. This technique is now employed daily under the auspices of the PIONEER project [Pioneer] dedicated to daily forecast over Europe.
Conclusion
The ESQUIF project documented numerous episodes of photooxidant pollution in the Paris area. The measurements and results have improved our understanding of the processes that generate pollution within the Paris area, as well as the contributions of transport in and out of the Paris region to local and regional pollution. Many research topics were addressed, with specific results for the Paris area, but there were some results that can improve our understanding of other polluted cities.
From all the intensive observation periods, it was found that pollution events were observed even when stagnant conditions appeared only very recently. The maximum thickness of the ABL varies much during all the episodes, and it was observed that oxidant peaks occurred for low or high ABL height. Moreover, these episodes appeared even in the cases of not so marked temperature inversion.
Alone, activities in Paris and its suburbs can produce pollution peaks that are often moderate. The most significant peaks are the result of this local production, amplified by meteorological conditions that favor weak winds (and high temperatures) that confine air masses for several days to regions with strong emissions. This finding highlights the importance of transport of pollutants between countries in Western Europe, and, from an attribution point of view, the need for highly accurate chemical boundary conditions.
Publications
- Beekmann M. and C.Derognat, 'Global model uncertainty evaluation constraint by measurements from the ESQUIF campaign', Journal of Geophysical Research, 2003.
- Blond N., 'Photochemical data assimilation and tropospheric pollution forecast', PhD Thesis, in french, Ecole Polytechnique, Palaiseau, 200 pp., December 2002.
- Derognat C., M.Beekmann, M. Baeumle, D.Martin and H.Schmidt, 'Effect of biogenic VOC emissions on the tropospheric chemistry during elevated ozone periods in Ile-de-france', Journal of Geophysical Research, 2003.
- Fochesatto G.J., P. Drobinski, C. Flamant, D. Guedalia, C. Sarrat, P.H. Flamant, J. Pelon, 'Evidence Of Dynamical Coupling Between The Residual Layer And The Developing Convective Boundary Layer', Boundary-Layer Meteorology, 99(3), 451-464, 2001
- Hourdin F., F. Couvreux, L. Menut, Parameterization of the dry convective boundary layer based on a mass flux representation of thermals, Journal of Atmospheric Sciences, 59, 1105-1123, 2002.
- Lafore J. P., Stein J., Asencio N., Bougeault P., Ducrocq V., Duron J., Fischer C., Hereil P., Mascart P., Masson V., Pinty J. P., Redelsperger J. L., Richard E. and Vila-Guerau de Arellano J., 'The Meso-NH atmospheric simulation system. Part I: adiabatic formulation and control simulations', Annales Geophysicae, 16 (1998) 90-109.
- Menut L., R. Vautard, M. Beekmann and C. Honoré, 'Sensitivity of Photochemical Pollution using the Adjoint of a Simplified Chemistry-Transport Model', Journal of Geophysical Research, 105, D12, 15,379-15,402, 2000a.
- Menut L., R. Vautard, C. Flamant, C. Abonnel, M. Beekmann, P. Chazette, P. H. Flamant, D. Gombert, D. Guedalia, D. Kley, M.P. Lefebvre, B. Lossec, D. Martin, G. Megie, M. Sicard, P. Perros, G. Toupance, 2000, 'Measurements and modeling of Atmospheric pollution over the Paris area: An overview of the ESQUIF project', Annales Geophysicae, 18, no 11, 1467-1481, 2000b.
- Menut L., 'Adjoint modelling for atmospheric pollution processes sensitivity at regional scale during the ESQUIF IOP2', Journal of Geophysical Research, 2003.
- Schmidt H. and D.Martin, 'Continental scale adjoint sensitivity of ozone concentrations in the paris region during the ESQUIF episodes', Journal of Geophysical Research, 2003.
- Sillman S., R. Vautard, L. Menut and D. Kley, 'O3-NOx-VOC sensitivity and NOx-VOC indicators in Paris: results from models and ESQUIF measurements', Journal of Geophysical Research, 2003.
- Vautard R., M. Beekmann, J. Roux, D. Gombert, 'Validation of a deterministic forecasting system for the ozone concentrations over the Paris area', Atmospheric Environment, 35, 2449-2461, 2001.
- Vautard R., D. Martin, M. Beekmann, R. Friedrich, A. Jaubertie, D. Kley, M. Lattuati, P. Moral, B. Neininger and J. Theloke, 'Paris emission inventory diagnostic from the ESQUIF airborne measurements and a chemistry-transport model', Journal of Geophysical Research, 2003.
- The complete database is composed of surface data, soundings and aircraft data.
- For each dataset, the name of the file and the responsible or contact during the campaign is indicated.
- The archive contains all data listed below.
- questions: send a mail to Laurent Menut [menut@lmd.ipsl.fr]
- Data format changed in january 1999. The old format stations names are in 'liststat.txt' and the new names are in 'old2new_apf.txt'.
- From 1992 to December 1995:
- [NO] apf_no_92to95.csv
- [NO2] apf_no2_92to95.csv
- From 1996 to December 1998:
- [NO] apf_no_96to98.csv
- [NO2] apf_no2_96to98.csv
- From 1992 to December 1998:
- [O3]apf_o3_92to98.csv
- From January to December 1999, files sort per stations types
- Observations:
- [O3] apf_o3_99_obs.csv
- [NO] apf_no_99_obs.csv
- [NO2]apf_no2_99_obs.csv
- Urban:
- [O3] apf_o3_99_urban.csv
- [NO] apf_no_99_urban.csv
- [NO2] apf_no2_99_urban.csv
- Rural:
- [O3] apf_o3_99_rural.csv
- [NO] apf_no_99_rural.csv
- [NO2] apf_no2_99_rural.csv
- Traffic:
- [NO] apf_no_99_traffic.csv
- [NO2] apf_no2_99_traffic.csv
- Observations:
- From 1992 to December 1995:
- Data file format [in french]: Esqf_MF_Stat_Formats
- Link between stations locations and coordinates [in french]: Esqf_MF_Stat_Positions
- List of stations [in english] with coordinates (latitude-longitude) and altitude ASL: mf_stats.html
- Files per IOPs
- Data format: multicolumn files with [1] Julian day, [2][3][4] flux at 375, 280 and 250 nm, [5] to [33] concentrations and errors (by pairs) for species: NO2, SO2, HNO2, CH2O, O4, O3, NAPHTALENE, TOLUENE, BENZENE, M-XYLENE, P-XYLENE, NO
- Download data:
- April to August 1998: [sanoa_04to0898.data] [6.5Mo]
- September to December 1998: [sanoa_09to1298.data] [5.7Mo]
- January to March 1999: [sanoa_01to0399.data] [3.4Mo]
- June to October 1999: [sanoa_06to1099.data] [7.4Mo]
- Data format: 4 columns file with [1] Decimal Julian day, [2] year-month-day-hour, [3] minutes and [4] measurement
- Download data: from 5 to 31 August 1998: [jno2_0898.data] [1.4Mo]
- Mileage data are sort by IOP:
- MIL6 : POI 6 Ecoublay (79) from 16/7/99 22:13 to 19/7/99 10:13
- MIL7 : POI 7 Vendrest (77) from 24/7/99 22:12 to 25/7/99 22:12
- MIL8 : POI 8 Vendrest (77) from 28/7/99 22:12 to 31/7/99 12:12
- MIL9 : POI 9 ENS-Paris (75) from 6/10/99 22:12 to 8/10/99 16:12
- All data are expressed in ppbv
- All dates are expressed in local time
- For each IOP, two to three files are available, following name format (MIL x *.txt) where:
- x is the IOP number
- * corresponds to the chamical species measured, with
- NMHC for non methanic hydrocarbons (from C2 to C8)
- NOx but only for NO, and in addition O3
- PAN for nitrats peroxy acethyl
- Each file contains seven in french comments lines, as follows:
- ESQUIF-MILEAGE-''' , with ''' = instrument name
- POIx , with x = IOP number
- "Lieu de la mission" is for location of measurement
- "Date debut" is for starting date using format dd/mm/yy hh:mm:ss
- "Date fin" is for ending date using format dd/mm/yy hh:mm:ss
- "Pas de mesure" is for acquisition frequency [hh:mm:ss]
- "Nombre d'especes" is for measured species quantity
- one line with "date-heure" for date and time, and species
- and then, data lines with [dd/mm/yy hh:mn] concentration in ppbv
IOP NHMC files NOx files PAN files 6 Mil6NMHC.txt Mil6NOx.txt Mil6PAN.txt 7 Mil7NMHC.txt Mil7NOx.txt Mil7PAN.txt 8 Mil8NMHC.txt Mil8NOx.txt Mil8PAN.txt 9 Mil9NMHC.txt Mil9NOx.txt Mil9PAN.txt Surface aerosols concentration - Black carbon in Saclay. Contact: Patrick Chazette
- Data from 20 July 1998 to 10 August 1998. aero_bc98.esq
- Data format: Day, hour:minute, concentration in n.g/m3
Lidar vertical profiles. Contact: Pierre H.Flamant
The measurements were taken using the SIRTA (Regional Instrumental Site for Atmospheric Remote Sensing) backscatter cloud/aerosol lidar at the IPSL at the École Polytechnique and surface meteorological and radiometric stations.- Visible Flux (W/m2): This parameter represents the total (direct + diffuse) visible flux incident on the ground, measured by a pyranometer in the spectral band (0.35 m to 4 m). The files (FV_POI?.....) are in ASCII format with two columns representing: time in decimal hours UT and visible flux in W/m2.
- HCLA: Height of the Atmospheric Boundary Layer (m). Calculated using a multi-slope algorithm based on the first derivative of the Lidar signal corrected for the solid angle of reception. The files (HCLA_POI?.....) are in ASCII format with two columns representing: time in decimal hours UT and instantaneous boundary layer height in metres.
- OPTDEPTH: Optical thickness up to 3 km altitude at 532 nm. Calculated from the integral of the specific extinction profile up to 3 km (AGL Above Ground Level) using KLETT's retrograde inversion. The files (OPTDEPTH_POI?.....) are in ASCII format with two columns representing: time in decimal hours UT and optical thickness at 532 nm.
- PR2: Optical power received and corrected for the solid angle of reception. This profile is directly related to the backscatter uncorrected by optical transmission and the instrumental constant. There are three types of files describing the PR2:
- T_poi?...: The measurement time of each profile in decimal hours (UT). This is a single-line vector whose dimension is the number (T) of PR2 profiles.
- X_poi?...: Altitude profile (m) with a resolution of 15 m for all PR2 profiles. This is a single-column vector whose dimension is the number (X) of altitude samples.
- PR2_poi?...: This is a matrix with X rows and T columns. Each column represents the profile at a given time. The lidar data are corrected for instrumental noise and sky background (taking the last 500 metres at 30 km).
Date Visible flux Optical thickness Boundary layer height POI1 - 25/07/98 FV_POI1_25071998 OPTDEPTH_POI1_25071998 HCLA_POI1_25071998 POI1 - 26/07/98 FV_POI1_26071998 OPTDEPTH_POI1_26071998 HCLA_POI1_26071998 POI2 - 07/08/98 POI2 - 08/08/98 FV_POI2_08081998 OPTDEPTH_POI2_08081998 HCLA_POI2_08081998 POI2 - 09/08/98 FV_POI2_09081998 OPTDEPTH_POI2_09081998 HCLA_POI2_09081998 POI3 - 16/06/99 FV_POI3_16061999 OPTDEPTH_POI3_16061999 HCLA_POI3_16061999 POI3 - 17/06/99 HCLA_POI3_17061999 POI4 - 25/06/99 FV_POI4_25061999 OPTDEPTH_POI4_25061999 HCLA_POI4_25061999 POI4 - 26/06/99 FV_POI4_26061999 POI5 - 01/07/99 FV_POI5_01071999 POI5 - 02/07/99 OPTDEPTH_POI5_02071999 HCLA_POI5_02071999 POI6 - 16/07/99 FV_POI6_16071999 OPTDEPTH_POI6_16071999 HCLA_POI6_16071999 POI6 - 17/07/99 FV_POI6_17071999 OPTDEPTH_POI6_17071999 HCLA_POI6_17071999 POI6 - 18/07/99 FV_POI6_18071999 OPTDEPTH_POI6_18071999 HCLA_POI6_18071999 Date PR2 - Time PR2 - Height PR2 - Profiles POI1 - 25/07/98 T_poi1_25071998 X_poi1_25071998 PR2_poi1_25071998 POI1 - 26/07/98 T_poi1_26071998 X_poi1_26071998 PR2_poi1_26071998 POI2 - 08/08/98 T_poi2_08081998 X_poi2_08081998 PR2_poi2_08081998 POI2 - 09/08/98 T_poi2_09081998 X_poi2_09081998 PR2_poi2_09081998 POI3 - 16/06/99 T_poi3_16061999 X_poi3_16061999 PR2_poi3_16061999 POI3 - 17/06/99 T_poi3_17061999 X_poi3_17061999 PR2_poi3_17061999 POI4 - 25/06/99 T_poi4_25061999 X_poi4_25061999 PR2_poi4_25061999 POI5 - 02/07/99 T_poi5_02071999 X_poi5_02071999 PR2_poi5_02071999 POI6 - 16/07/99 T_poi6_16071999 X_poi6_16071999 PR2_poi6_16071999 POI6 - 17/07/99 T_poi6_17071999 X_poi6_17071999 PR2_poi6_17071999 POI6 - 18/07/99 T_poi6_18071999 X_poi6_18071999 PR2_poi6_18071999 Soundings Trappes. Contact: Laurent Menut
- Files correspond to:
- Raw data (Meteo-France) including all points (.raw files), with:
- prefix CRA for PTU data
- prefix CRV for wind speed and direction data
- Selected points (Meteo-France) (.ret files)
- Treated raw data files: Prefix RST_raw
- Treated selected points files: Prefix RST_ret
- Raw data (Meteo-France) including all points (.raw files), with:
- Maximum height is limited to 5km from ground
- Altitude '0' corresponds to ground level in Trappes
- Trappes is 168m above sea level
- Files "RST_ret*" et "RST_raw*" include 12 columns:
- Altitude in km
- Pressure (hPa)
- Temperature (degres Celsius)
- Temperature (degres Kelvin)
- Potential temperature (Kelvin)
- Virtual potential temperature (Kelvin)
- Relative humidity (%)
- Specific humidity (g/kg)
- Zonal wind component (m/s)
- Meridian wind component (m/s)
- Wind speed (m/s)
- Wind direction (North=0, South=180) in degrees
POI Date Heure (T.U) Raw files PTU Raw files wind Saved points Raw files after analysis Saved points after analysis 1 250798 23h15 cra425.raw crv425.raw RST_raw_250798_2315 1 260798 06h00 cra426.raw crv426.raw RST_raw_260798_0600 1 260798 09h00 cra427.raw crv427.raw RST_raw_260798_0900 1 260798 11h15 cra428.raw crv428.raw RST_raw_260798_1115 1 260798 15h00 cra429.raw crv429.raw RST_raw_260798_1500 1 260798 18h00 cra430.raw crv430.raw RST_raw_260798_1800 1 260798 23h15 cra431.raw crv431.raw RST_raw_260798_2315 2 060898 23h16 CRA453.RAW CRV453.RAW 98_64535.RET RST_raw_060898_2316 RST_ret_060898_2316 2 070898 05h32 CRA454.RAW CRV454.RAW 98_64536.RET RST_raw_070898_0532 RST_ret_070898_0532 2 070898 08h27 CRA455.RAW CRV455.RAW 98_64537.RET RST_raw_070898_0827 RST_ret_070898_0827 2 070898 11h19 CRA456.RAW CRV456.RAW 98_64538.RET RST_raw_070898_1119 RST_ret_070898_1119 2 070898 14h30 CRA457.RAW CRV457.RAW 98_64539.RET RST_raw_070898_1430 RST_ret_070898_1430 2 070898 17h27 CRA458.RAW CRV458.RAW 98_64540.RET RST_raw_070898_1727 RST_ret_070898_1727 2 070898 23h18 CRA459.RAW CRV459.RAW 98_64541.RET RST_raw_070898_2318 RST_ret_070898_2318 2 080898 05h28 CRA460.RAW CRV460.RAW 98_64542.RET RST_raw_080898_0528 RST_ret_080898_0528 2 080898 08h30 CRA461.RAW CRV461.RAW 98_64543.RET RST_raw_080898_0830 RST_ret_080898_0830 2 080898 11h18 CRA462.RAW CRV462.RAW 98_64544.RET RST_raw_080898_1118 RST_ret_080898_1118 2 080898 14h28 CRA463.RAW CRV463.RAW 98_64545.RET RST_raw_080898_1428 RST_ret_080898_1428 2 080898 17h27 CRA464.RAW CRV464.RAW 98_64546.RET RST_raw_080898_1727 RST_ret_080898_1727 2 080898 23h17 CRA465.RAW CRV465.RAW 98_64547.RET RST_raw_080898_2317 RST_ret_080898_2317 2 090898 05h34 CRA466.RAW CRV466.RAW 98_64548.RET RST_raw_090898_0534 RST_ret_090898_0534 2 090898 08h28 CRA467.RAW CRV467.RAW 98_64549.RET RST_raw_090898_0828 RST_ret_090898_0828 2 090898 11h16 CRA468.RAW CRV468.RAW 98_64550.RET RST_raw_090898_1116 RST_ret_090898_1116 2 090898 14h25 CRA469.RAW CRV469.RAW 98_64551.RET RST_raw_090898_1425 RST_ret_090898_1425 2 090898 17h26 CRA470.RAW CRV470.RAW 98_64552.RET RST_raw_090898_1726 RST_ret_090898_1726 2 090898 23h16 CRA471.RAW CRV471.RAW 98_64553.RET RST_raw_090898_2316 RST_ret_090898_2316 3 150699 23h15 CRA340.RAW CRV340.RAW 99_65190.RET RST_raw_150699_2315 RST_ret_150699_2315 3 160699 11h29 CRA341.RAW CRV341.RAW 99_65191.RET RST_raw_160699_1129 RST_ret_160699_1129 3 160699 23h18 CRA342.RAW CRV342.RAW 99_65192.RET RST_raw_160699_2318 RST_ret_160699_2318 3 170699 11h50 CRA343.RAW CRV343.RAW 99_65193.RET RST_raw_170699_1150 RST_ret_170699_1150 3 170699 23h14 CRA344.RAW CRV344.RAW 99_65194.RET RST_raw_170699_2314 RST_ret_170699_2314 4 240699 23h16 CRA358.RAW CRV358.RAW 99_65208.RET RST_raw_240699_2316 RST_ret_240699_2316 4 250699 08h58 CRA359.RAW CRV359.RAW 99_65209.RET RST_raw_250699_0858 RST_ret_250699_0858 4 250699 11h14 CRA360.RAW CRV360.RAW 99_65210.RET RST_raw_250699_1114 RST_ret_250699_1114 4 250699 15h01 CRA361.RAW CRV361.RAW 99_65211.RET RST_raw_250699_1501 RST_ret_250699_1501 4 250699 23h19 CRA362.RAW CRV362.RAW 99_65212.RET RST_raw_250699_2319 RST_ret_250699_2319 4 260699 11h19 CRA363.RAW CRV363.RAW 99_65213.RET RST_raw_260699_1119 RST_ret_260699_1119 5 300699 23h12 CRA372.RAW CRV372.RAW 99_65222.RET RST_raw_300699_2312 RST_ret_300699_2312 5 010799 11h33 CRA373.RAW CRV373.RAW 99_65223.RET RST_raw_010799_1133 RST_ret_010799_1133 5 010799 23h32 CRA374.RAW CRV374.RAW 99_65224.RET RST_raw_010799_2332 RST_ret_010799_2332 5 020799 08h59 CRA375.RAW CRV375.RAW 99_65225.RET RST_raw_020799_0859 RST_ret_020799_0859 5 020799 11h17 CRA376.RAW CRV376.RAW 99_65226.RET RST_raw_020799_1117 RST_ret_020799_1117 5 020799 15h05 CRA377.RAW CRV377.RAW 99_65227.RET RST_raw_020799_1505 RST_ret_020799_1505 6 150799 23h14 CRA404.RAW CRV404.RAW 99_65254.RET RST_raw_150799_2314 RST_ret_150799_2314 6 160799 11h24 CRA405.RAW CRV405.RAW 99_65255.RET RST_raw_160799_1124 RST_ret_160799_1124 6 160799 23h16 CRA406.RAW CRV406.RAW 99_65256.RET RST_raw_160799_2316 RST_ret_160799_2316 6 170799 11h13 CRA407.RAW CRV407.RAW 99_65257.RET RST_raw_170799_1113 RST_ret_170799_1113 6 170799 23h15 CRA408.RAW CRV408.RAW 99_65258.RET RST_raw_170799_2315 RST_ret_170799_2315 6 180799 11h16 CRA409.RAW CRV409.RAW 99_65259.RET RST_raw_180799_1116 RST_ret_180799_1116 6 180799 23h17 CRA410.RAW CRV410.RAW 99_65260.RET RST_raw_180799_2317 RST_ret_180799_2317 7 230799 23h19 CRA420.RAW CRV420.RAW 99_65270.RET RST_raw_230799_2319 RST_ret_230799_2319 7 240799 11h12 CRA421.RAW CRV421.RAW 99_65271.RET RST_raw_240799_1112 RST_ret_240799_1112 7 240799 23h19 CRA422.RAW CRV422.RAW 99_65272.RET RST_raw_240799_2319 RST_ret_240799_2319 7 250799 11h18 CRA423.RAW CRV423.RAW 99_65273.RET RST_raw_250799_1118 RST_ret_250799_1118 7 250799 23h13 CRA424.RAW CRV424.RAW 99_65274.RET RST_raw_250799_2313 RST_ret_250799_2313 8 270799 23h15 CRA428.RAW CRV428.RAW 99_65278.RET RST_raw_270799_2315 RST_ret_270799_2315 8 280799 23h17 CRA430.RAW CRV430.RAW 99_65280.RET RST_raw_280799_2317 RST_ret_280799_2317 8 290799 11h26 CRA431.RAW CRV431.RAW 99_65281.RET RST_raw_290799_1126 RST_ret_290799_1126 8 290799 23h15 CRA432.RAW CRV432.RAW 99_65282.RET RST_raw_290799_2315 RST_ret_290799_2315 8 300799 11h17 CRA433.RAW CRV433.RAW 99_65283.RET RST_raw_300799_1117 RST_ret_300799_1117 8 300799 23h16 CRA434.RAW CRV434.RAW 99_65284.RET RST_raw_300799_2316 RST_ret_300799_2316 8 310799 11h16 CRA435.RAW CRV435.RAW 99_65285.RET RST_raw_310799_1116 RST_ret_310799_1116 8 310799 23h12 99_65286.RET RST_ret_310799_2312 9 061099 23h14 CRA597.RAW CRV597.RAW 99_65447.RET RST_raw_061099_2314 RST_ret_061099_2314 9 071099 06h08 CRA598.RAW CRV598.RAW 99_65448.RET RST_raw_071099_0608 RST_ret_071099_0608 9 071099 09h01 CRA599.RAW CRV599.RAW 99_65449.RET RST_raw_071099_0901 RST_ret_071099_0901 9 071099 11h23 CRA600.RAW CRV600.RAW 99_65450.RET RST_raw_071099_1123 RST_ret_071099_1123 9 071099 15h12 CRA601.RAW CRV601.RAW 99_65451.RET RST_raw_071099_1512 RST_ret_071099_1512 9 071099 23h16 CRA602.RAW CRV602.RAW 99_65452.RET RST_raw_071099_2316 RST_ret_071099_2316 9 081099 06h35 CRA603.RAW CRV603.RAW 99_65453.RET RST_raw_081099_0635 RST_ret_081099_0635 9 081099 09h24 CRA604.RAW CRV604.RAW 99_65454.RET RST_raw_081099_0924 RST_ret_081099_0924 9 081099 11h22 CRA605.RAW CRV605.RAW 99_65455.RET RST_raw_081099_1122 RST_ret_081099_1122 9 081099 23h18 CRA606.RAW CRV606.RAW 99_65456.RET RST_raw_081099_2318 RST_ret_081099_2318 10 250100 23h19 CRA053.RAW 00_65717.RET RST_raw_250100_2319 RST_ret_250100_2319 10 260100 06h10 CRA054.RAW CRV054.RAW 00_65718.RET RST_raw_260100_0610 RST_ret_260100_0610 10 260100 09h02 CRA055.RAW CRV055.RAW 00_65719.RET RST_raw_260100_0902 RST_ret_260100_0902 10 260100 11h41 CRA056.RAW CRV056.RAW 00_65720.RET RST_raw_260100_1141 RST_ret_260100_1141 10 260100 15h00 CRA057.RAW CRV057.RAW 00_65721.RET RST_raw_260100_1500 RST_ret_260100_1500 10 260100 23h27 CRA058.RAW CRV058.RAW 00_65722.RET RST_raw_260100_2327 RST_ret_260100_2327 10 270100 06h32 CRA059.RAW CRV059.RAW 00_65723.RET RST_raw_270100_0632 RST_ret_270100_0632 10 270100 09h12 CRA060.RAW CRV060.RAW 00_65724.RET RST_raw_270100_0912 RST_ret_270100_0912 10 270100 11h36 CRA061.RAW CRV061.RAW 00_65725.RET RST_raw_270100_1136 RST_ret_270100_1136 10 270100 15h04 CRA062.RAW CRV062.RAW 00_65726.RET RST_raw_270100_1504 RST_ret_270100_1504 10 270100 23h15 CRA063.RAW CRV063.RAW 00_65727.RET RST_raw_270100_2315 RST_ret_270100_2315 10 280100 11h27 CRA064.RAW CRV064.RAW 00_65728.RET RST_raw_280100_1127 RST_ret_280100_1127 SAOZ Verrieres le buisson. Contact: Florence Goutail
- Ozone values integrated over the whole column
- Multicolumn file: Esq_SAOZ_data
- File format per column
- Julian day (for year 1998 only)
- [O3] average value at 0600 UTC
- [O3] average value at 1800 UTC
- [NO2] average value at 0600 UTC
- [NO2] average value at 1800 UTC
Aircraft data AMDAR. Contact: Laurent Menut
- Download data:
- From 16 June 1999 to 31 July 1999: amdar_06to0799.data
- From 7 to 8 October 1999: amdar_1099.data
- From 26 to 27 Janvier 2000: amdar_0100.data
- Data format: Multicolumn files with
- [1] aircraft,
- [2] flight number,
- [3] year-month-day-hour-min,
- [4] latitude,
- [5] longitude,
- [6] altitude,
- [7] potential temperature,
- [8] wind dir.,
- [9] wind speed
Aircraft data ARAT INSU. Contact: Pascal Perros
- Data for 17, 29 and 30 July 1999
- Data format: Documentation arat_paramlist.pdf
- For each flight, three files:
- ascii file with 1s frequency data
- ascii file with 30s frequency data + NOx
- ascii file with PAN
Flight
noType Date start/end
timefreq. 1S freq. 30S PAN 38 [Chemical regime 1] 17/07/99 10:55/14:25 V38-1S2.TXT V38_30s.txt V38PAN.txt 39 [Chemical regime 2] 17/07/99 15:05/17:53 V39-1S2.TXT V39_30s.txt V39PAN.txt 40 [Plume 1] 29/07/99 11:05/13:37 V40-S2.TXT V40_30s.txt V40PAN.txt 41 [Plume 2] 29/07/99 14:51/17:08 V41-1S2.TXT V41_30s.txt V41PAN.txt 42 [Chemical regime 3] 30/07/99 11:57/14:48 V42-1S2.TXT V42_30s.txt V42PAN.txt Aircraft data AZTEC Meteo-France. Contact: Daniel Martin
- Data for [22 July 1998 -> 9 August 1998] and [25 June -> 7 Oct. 1999]
- Documentation (PDF, in french)
- 1998: doc_azmf_98.pdf
- 1999: doc_azmf_99.pdf
POI Flight # Date Summary Data 1 0298 22 Juillet 1998 az0298.htm ~ 1 0598 25 Juillet 1998 az0598.htm az9805_1 1 0698 26 Juillet 1998 az0698.htm az9806_1 1 0798 26 Juillet 1998 az0798.htm az9807_1 1 0898 26 Juillet 1998 az0898.htm az9808_1 2 0998 7 Aout 1998 az0998.htm az9809_1 2 1098 7 Aout 1998 az1098.htm az9810_1 2 1198 8 Aout 1998 az1198.htm az9811_1 2 1298 8 Aout 1998 az1298.htm az9812_1 2 1398 8 Aout 1998 az1398.htm az9813_1 2 1498 9 Aout 1998 az1498.htm az9814_1 2 1598 9 Aout 1998 az1598.htm az9815_1 POI Flight # date Begin End Take-off Landing Data 4 17 25 juin 11h24m19s 14h15m21s 11h40m38s 14h15m21s az9917_1 5 18 02 juil. 06h53m21s 09h39m00s 07h0m908s 09h08m09s az9918_1 5 19 02 juil. 11h58m48s 15h07m19s 12h1m500s 15h07m20s az9919_1 6 23 16 juil. 11h42m54s 14h29m03s 12h0m023s 14h29m03s az9923_1 6 24 17 juil. 06h58m26s 10h13m00s 07h1m307s 10h11m02s az9924_1 6 25 17 juil. 11h58m33s 15h18m54s 12h0m850s 15h15m19s az9925_1 8 27 29 juil. 06h22m15s 08h27m39s 06h3m543s 08h27m39s az9927_1 8 28 29 juil. 12h02m40s 13h39m00s 12h1m939s 13h32m47s az9928_1 9 34 07oct. 08h48m21s 10h28m39s 09h0m300s 10h25m30s az9934_1 Aircraft data AZTEC LSCE. Contact: Daniel Martin
- Data format (in french): data_readme.html
- Text format files:
- Summer 1998: IOPs 1 and 2 -> plvts12.txt
- Summer 1999: IOPs 3 to 8 -> plvts345678.txt
- Excel format files:
- Summer 1998: IOPs 1 and 2 -> plvts12.csv
- Summer 1999: IOPs 3 to 8 -> plvts345678.csv
Aircraft data METAIR DIMONA. Contact: Bruno Neiniger
- Field Phase Report for ESQUIF-99 (3 campaigns from June 25 to July
18 1999)
Flight (Date) morning flight afternoon flight remarks (details below) F990625A 08:12 - 10:22 F990625B 12:21 - 16:21 F990702A 07:32 - 09:54 no C4 F990702B 12:22 - 16:34 no C4 F990716A 11:35 - 15:36 no NOxTOy after 3 h F990717A 07:54 - 1005 F990717B 14:16 - 18:24 late, but, "best" O3-plume found F990718A 08:00 - 10:21 remarkable reservoir layer F990718B 12:16 - 16:15
- Format files '.DOC'
- MetAirFPR_ESQUIF99.doc
- MetAirVOC_ESQUIF99.doc
Flight Files MIN Files GCD Files 10S F990625A F990625A.MIN F990625A.GCD F990625A.10S F990625B F990625B.MIN F990625B.GCD F990625B.10S F990702A F990702A.MIN F990702A.GCD F990702A.10S F990702B F990702B.MIN F990702B.GCD F990702B.10S F990716A F990716A.MIN F990716A.GCD F990716A.10S F990717A F990717A.MIN F990717A.GCD F990717A.10S F990717B F990717B.MIN F990717B.GCD F990717B.10S F990718A F990718A.MIN F990718A.GCD F990718A.10S F990718B F990718B.MIN F990718B.GCD F990718B.10S Aircraft data MERLIN Meteo-France. Contact: Marie-Pierre Lefebvre
- Post-script file for data format: fichasc_merlin.ps
- Some explanations about files formats and remarks:
- First column is UTC time and counter begins at 00:00
- Columns 2 and 3 are latitude and longitude respectively
- Column 5 is altitude
- 24 is CO, but values are wrong for flight 9917
- 25 is NO but is not realistic
- 26 is NOy et 27 ozone
Flight Date Start End Flight notes File 9835 7 August 1998 06h09 07h11 me3598.htm me9835_1.V2.asc 9836 7 August 1998 12h24 15h40 me3698.htm me9836_1.V2.asc 9837 8 August 1998 04h53 08h32 me3798.htm me9837_1.V2.asc 9838 8 August 1998 12h32 14h48 me3898.htm me9838_1.V2.asc 9839 9 August 1998 04h51 08h26 me3998.htm me9839_1.V2.asc 9840 9 August 1998 12h54 15h13 me4098.htm me9840_1.V2.asc Flight Date Header File 9913 25 Juin 1999 Afternoon (POI4) me9913_1.f99.v2.txt me9913_1.f99.v2.asc 9914 02 July 1999 Afternoon (POI5) me9914_1.f99.v2.txt me9914_1.f99.v2.asc 9915 17 July 1999 Afternoon (POI6) me9915_1.f99.v2.txt me9915_1.f99.v2.asc 9916 18 July 1999 Morning (POI6) me9916_1.f99.v2.txt me9916_1.f99.v2.asc 9917 25 July 1999 Morning (POI7) me9917_1.f99.v2.txt me9917_1.f99.v2.asc 9918 25 July 1999 Afternoon (POI7) me9918_1.f99.v2.txt me9918_1.f99.v2.asc 9919 29 July 1999 Intercomparison (POI8) me9919_1.f99.v2.txt me9919_1.f99.v2.asc 9920 30 July 1999 Morning (POI8) me9920_1.f99.txt me9920_1.f99.asc 9921 30 July 1999 Afternoon (POI8) me9921_1.f99.txt me9921_1.f99.asc
Database
esquif_database.tar.gz (144 Mo) |
AIRPARIF [Paris area]. Contact: Mireille Lattuati
Meteo-France surface stations. Contact: Laurent Menut
| Period | Data file |
| 25 to 28 July 1998 | Esqf_MF_Stat_poi1.lst |
| 5 to 12 August 1998 | Esqf_MF_Stat_poi2.lst |
| 16 June 1999 | Esqf_MF_Stat_poi3.lst |
| 25 June 1999 | Esqf_MF_Stat_poi4.lst |
| 2 July 1999 | Esqf_MF_Stat_poi5.lst |
| 16 to 18 July 1999 | Esqf_MF_Stat_poi6.lst |
| 24 to 25 July 1999 | Esqf_MF_Stat_poi7.lst |
| 28 to 31 July 1999 | Esqf_MF_Stat_poi8.lst |
| 7 October 1999 | Esqf_MF_Stat_poi9.lst |
| 26 to 27 January 2000 | Esqf_MF_Stat_poi10.lst |
SANOA [DOAS spectrometer, center of Paris]. Contact: Robert Vautard
| Pollutant | O3 | NO | NO2 | SO2 | CS2 | CH2O |
| threshold (ppb) | 1 | 3 | 1.5 | 0.3 | 6 | 1.7 |
| Pollutant | HNO2 | Toluene | Benzene | M-Xylene | P-Xylene | Naphtalene |
| threshold (ppb) | 0.7 | 3 | 2 | 1 | 1 | 0.2 |